Glossary
Customer service metrics show you whether your support is keeping customers coming back. They're also what you plan automation around: you watch the numbers, then tune your playbooks and docs as your products change. This glossary and our KPI guide help you pick the ones worth tracking.

What to measure
Each of these tells you something about the customer's experience. If you're only going to track five, pick them from here. Our KPI guide covers how to measure every one.
How easy it was for the customer to get their problem sorted.
CEB's research found it predicts loyalty better than delight does.
The share of issues fixed in one go. Only comparable if you pin down the time window and who gets to call it resolved.
How often the same customer comes back about the same thing.
It catches the tickets marked resolved that weren't.
How often a conversation gets passed up a level.
Lower isn't always better... a team that never escalates is usually guessing.
The share of conversations an AI agent finishes without a person stepping in.
Worthless if half of them come back.
How long until the problem's fixed. Use the median and split it by complexity, or one ugly ticket wrecks the average.
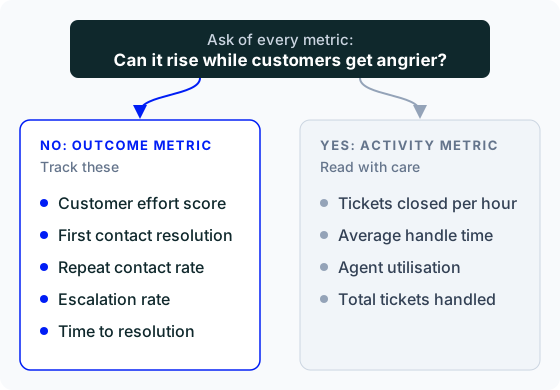
Tickets per hour, handle time and agent utilisation measure how busy your team is.
They look great in a report but say little about whether customers come back.
Here's why they mislead.
A to Z
The words that turn up in your dashboards and in vendor demos, defined in plain English.
One test
Pretty much. Help desk metrics usually means what your ticketing tool reports by default, mostly volume and speed. Our test for any of them: if the number can rise while customers get angrier, it's an activity metric, and it belongs below the outcome ones.
Hay.chat's dashboard tracks your resolution rate and every escalation, so you can see which playbooks and docs to adjust as your products change.